
When hurricanes barrel toward the U.S., disaster responders have hours—not days—to plan. For veteran-led humanitarian nonprofit Team Rubicon, those precious hours are where Geographic Information Systems tools make the difference between just monitoring a storm and responding to it. Now, GIS disaster response mapping turns data into action, enabling relief teams to see, decide, and respond in real time.
The Hurricane Playbook: GIS Disaster Response From Forecast to Field
When it comes to disaster response preparedness, the first maps come even before the first raindrop falls. As storms begin to spin up, Team Rubicon’s operations team monitors National Hurricane Center forecasts, tracking projected hurricane paths, wind fields, and rainfall totals. GIS disaster response analysts layer those forecasts over population density, flood-prone zones, and vulnerable communities within the likely path of the storm, as well as Team Rubicon resources, like caches of supplies, trailers, and teams of disaster responders. Lately, the disaster relief nonprofit has even been layering in details on its partners’ locations—like Home Depot, Stihl, Ford, Hertz, and Enterprise.
The result: GIS disaster response dashboards that show who might be impacted, how badly, where Route Clearance Teams (RCT) should be staged, and more.
“GIS is often considered the ‘science of where.’ We harness the power of GIS to help us answer questions such as ‘where are our Greyshirts located? Where are our Saw-2 and Heavy Equipment Operators located? Where are we currently operating or responding?’,” says Ed Amrhein, a volunteer who helps lead Team Rubicon’s geospatial team. “When you can see where storm surge overlaps with vulnerable communities, as well as where all of your resources are located, you know where to prioritize first.”
Using GIS to Power Real-Time Disaster Response Operations
Once a hurricane makes landfall, satellite imagery and aerial photography pour in, often within hours. Team Rubicon integrates this fresh imagery into ArcGIS Online, and utilizes those bits of information to highlight areas of interest.

“If we see five blocked roads in one county, but only one blocked road in the neighboring county, then we’ll send Route Clearance Teams to county A,” says Team Rubicon’s Senior Associate for Operations Support and Planning, Francesca Williams.
Then, RCT and Recon field teams that had been staged just outside the expected hurricane path begin pushing into the disaster zone.
These field teams use apps like Fulcrum, ArcGIS Field Maps, and Survey123 to feed GIS disaster response data back to headquarters. This two-way stream turns the map into a living operational picture, showing such things as which roads are blocking access for first responders and emergency vehicles, how many homes within a block or area are damaged or destroyed, and where power is out.
As the map updates, so does the plan—whether that’s to deploy heavy equipment operators to open roadways for emergency vehicles, dispatch saw teams to clear debris, or send out recon teams to further assess where disaster survivors need Team Rubicon’s help most.
Serving Survivors With Precision Through GIS Disaster Response
Once the immediate storm has passed and it’s time for recovery to begin, Team Rubicon begins standing up operations to serve communities and survivors. Identifying those with the most unmet need and serving them quickly is essential.
By overlaying community data—such as intel from the Social Vulnerability Index, or SVI—with damage assessments, Team Rubicon can identify those communities with the least ability to recover from the disaster themselves, and who haven’t yet received help, down to the street level.
In the aftermath of Hurricane Helene, for example, Williams created a GIS disaster response dashboard that tracked not only where access to the disaster zone was blocked, but also where other NGOs were already serving.
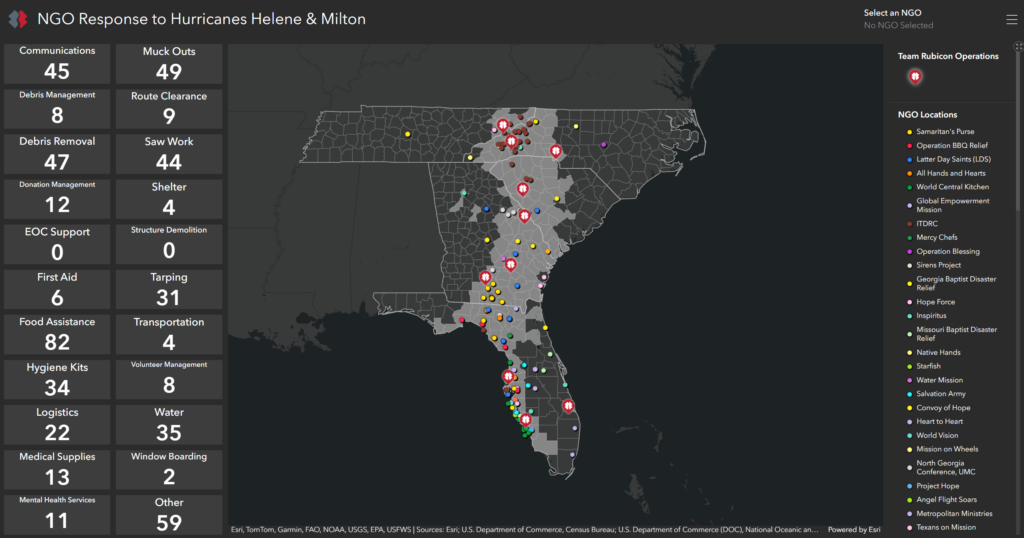
“I had a team put together that was searching the web, social media reports like Instagram and Facebook, news reports, NGO websites, and other places to find out any location that an NGO was responding to Helene in North Carolina,” says Williams. “Then, we were putting that information into a Survey123, which would automatically populate the ArcGIS dashboard I had created.”
That dashboard then played a huge part in helping Team Rubicon identify both where its volunteers weren’t needed, because others were already there, and where unmet need existed.
“It’s about equity in disaster relief,” says Williams. “GIS disaster response tools help ensure no survivor is invisible just because they live in a hard-to-reach place.”
Beyond Disaster Response: Long-Term Recovery With GIS
For Team Rubicon, the work doesn’t end when the cameras fade. As part of its long-term recovery program, Team Rubicon’s volunteers, known as Greyshirts, regularly return to devastated areas months or even years after the storm.
Recently, for example, Williams used ArcGIS Business Analyst to conduct research for a possible long-term recovery project after the 2025 Texas floods. Within the hub, Williams dug into county-level data to learn things like the number of people who had or did not have homeowner’s insurance, as well as the number of people in the county who had homeowner’s insurance but which wasn’t the hazard specific insurance they needed. Such intel could serve to help the organization determine whether unmet needs remain in the community, and if it can assist in the future.
Training the Next Generation of GIS Disaster Responders
Team Rubicon’s staff and volunteer leaders aren’t just using GIS to monitor and respond to disasters, they’re also allowing professionals who are developing GIS skills and capabilities in training or on the job to grow their own knowledge, skills, and portfolios.
The disaster relief org’s volunteer GIS disaster response cadre comprises a network of Greyshirts who can jump into any disaster, open their laptop or tablet, and start turning raw data into actionable insight—whether the mission is hurricane relief in Florida or wildfire response in California. Tapped before, during, and after disasters, the GIS cadre helps build maps of disasters; dashboards about disaster response operations; and even provide operational analysis. Fundamentally, those volunteers are getting real-world GIS experience responding to real disasters, all while helping people on their worst day.
Maps With a Mission
In a disaster, maps aren’t just lines and colors: they’re life-saving decisions made visible. For Team Rubicon, when it comes to disaster response, GIS is the connective tissue between satellites in space, boots on the ground, and survivors in need.
Or, as their GIS team likes to say: “If it’s not on the map, it doesn’t exist for the operation.”


